January is National Radon Action Month, an annual push to raise awareness of the invisible but deadly threat of radon gas. As the second-leading cause of lung cancer in the United States, radon exposure often goes unnoticed until it’s too late.
Homeowners frequently make a critical mistake: assuming their homes are safe because their neighbor’s radon test came back low. Here’s the hard truth: radon levels can vary drastically from one property to another, even within the same block or neighborhood.
Radon Is Hyper-Localized
Radon is a radioactive gas that comes from the natural breakdown of uranium in soil and rock. It seeps into homes and buildings through foundation cracks, gaps, or poorly sealed pipes. However, radon concentration depends on hyper-local factors, including:
- Soil Composition – Tiny variations in uranium content, even beneath neighboring homes, can cause levels to swing dramatically.
- Home Construction – Differences in ventilation, HVAC systems, foundation materials, and crawl spaces impact radon accumulation.
- Air Pressure – Changes in air pressure inside one home versus another can either draw in or reduce radon intrusion.
For a real world example, let’s look at the radon levels reported by Colorado in 2020. Per the CDC website:
- Alamosa County reported no radon levels higher than 3.1 pCi/L in 2020; while still relatively high, this is just below the EPA action level.
- Huerfano County, its neighbor to the east, reported radon levels as high as 56.9 pCi/L that year.
The difference? Localized soil uranium levels, home construction methods, and testing coverage. Two homes, just miles apart (or even feet apart) can experience completely opposite radon risks.
Data Doesn’t Lie: Extreme Variability Within States
To understand just how unpredictable radon can be, let’s look at real data from Colorado, New Mexico, and Texas, three states with varied geological profiles and radon trends.

Colorado
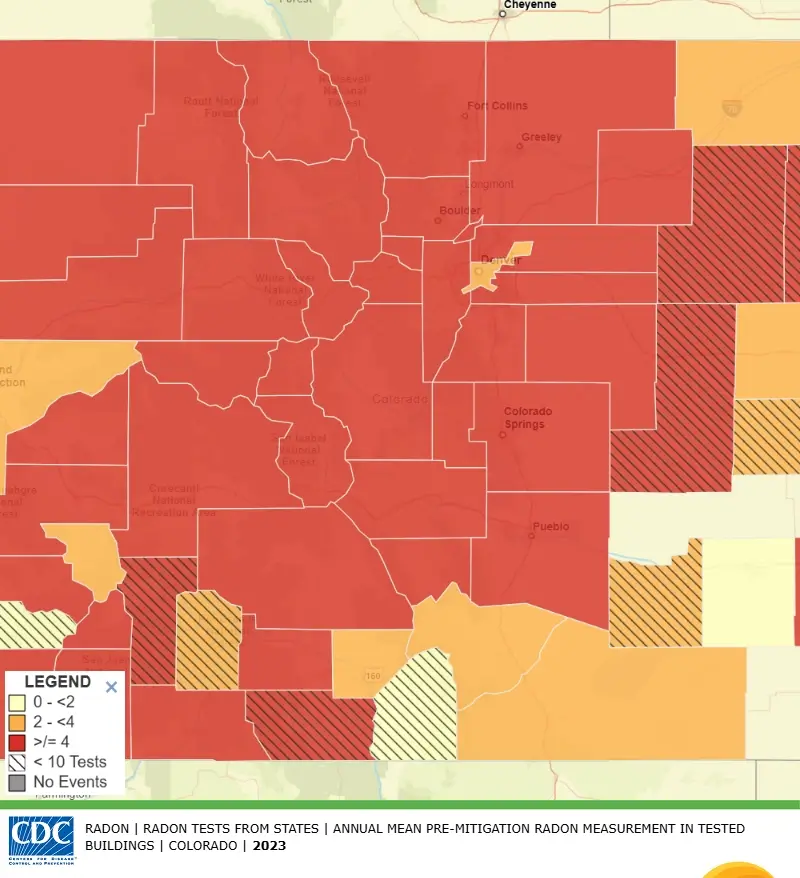
Colorado is a radon hotspot, with levels that often exceed the EPA action level of 4.0 pCi/L. In Adams County, radon readings hit a shocking 207.2 pCi/L in 2014 – proof that certain homes can have dangerously high concentrations. However, not every county tells the same story.
Counties like Alamosa reported much lower average levels of 2.1 pCi/L in 2023. While this might sound reassuring, it highlights the unpredictability of radon. One neighborhood, or even one home, can experience vastly different results compared to nearby areas. The lesson here: even in a state where radon is common, assumptions about average levels do not apply to individual properties.


New Mexico
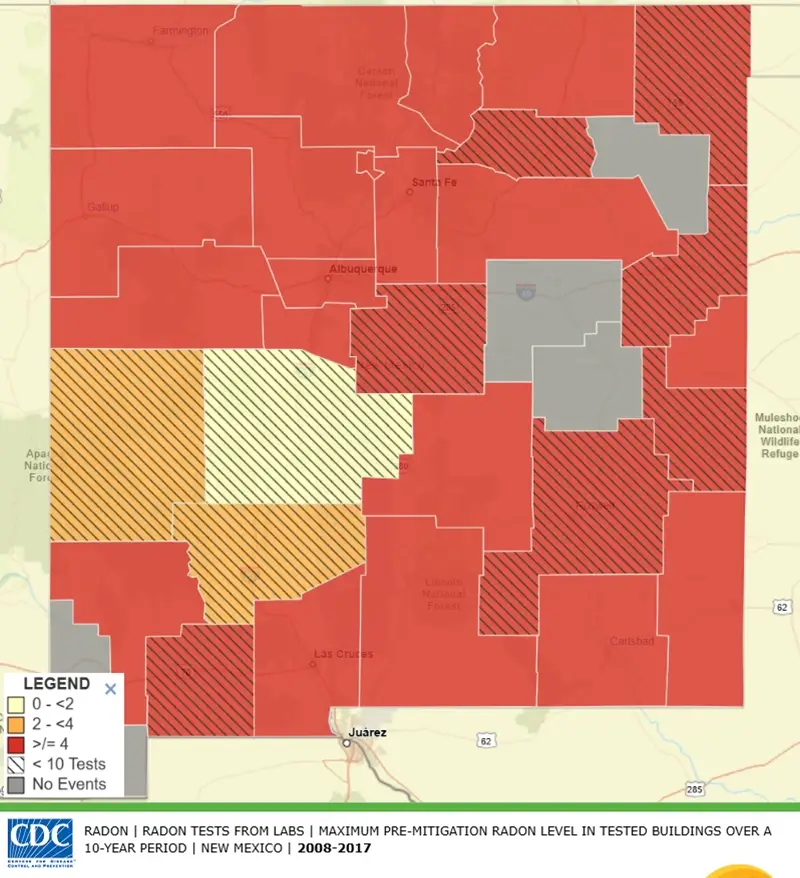
New Mexico’s geological diversity produces similarly unpredictable results. In Bernalillo County, a 10-year maximum of 57.4 pCi/L was recorded – nearly 15 times higher than the EPA’s action level. Meanwhile, other counties like Catron saw lower values, with limited testing often reflecting <10 results.
This range reveals two important points:
- Even in areas with lower average radon, individual homes can have severe risks.
- Under-tested counties may be hiding unaddressed radon problems.
Testing remains essential, especially in a state with such unpredictable highs and lows.

Texas
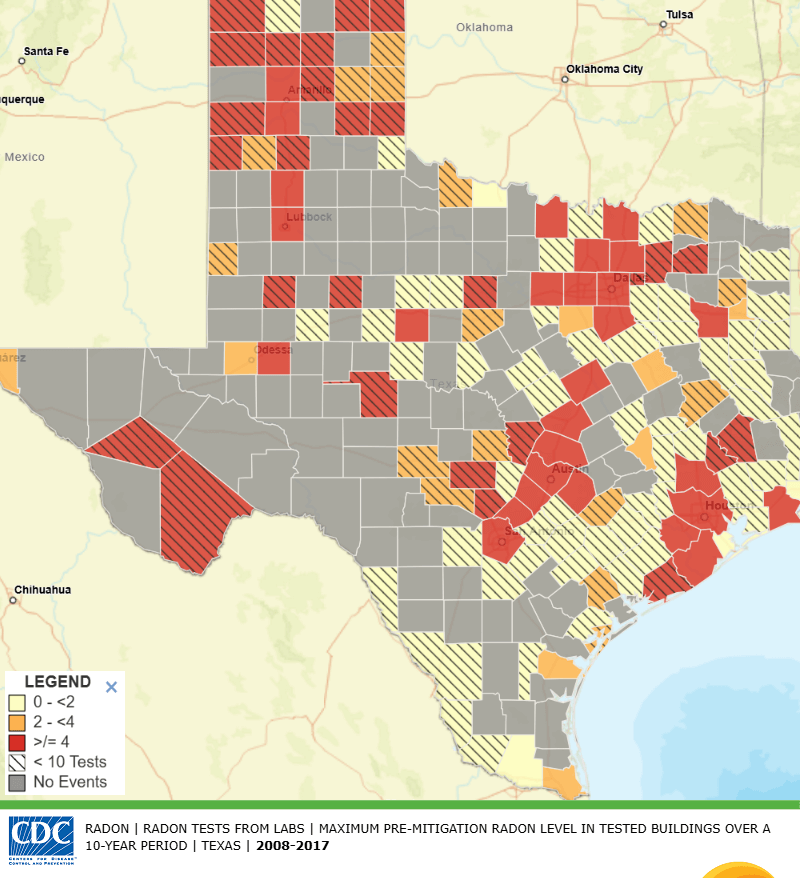
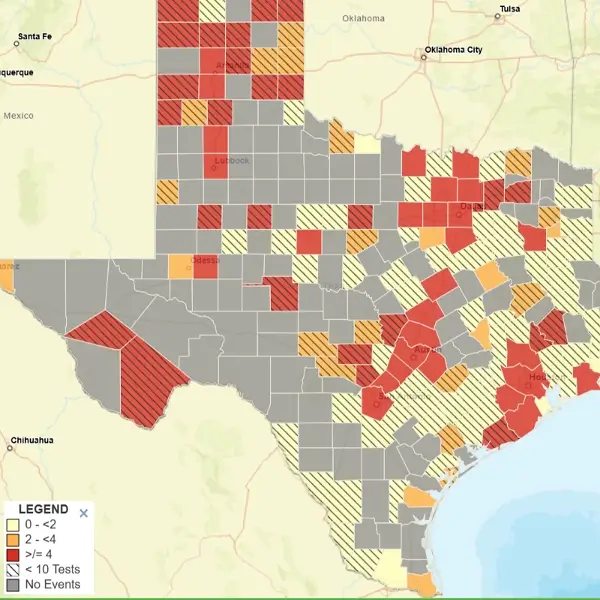
Texas poses a unique challenge when it comes to radon awareness. Many counties reported “No Events” over a 10-year period, but this reflects a lack of testing, not a lack of radon. Without sufficient data, potential risks remain hidden, and isolated radon hotspots tied to uranium-rich soil or geological features can still exist.
This data gap creates a false sense of security, particularly in areas not traditionally associated with high radon levels. In a state as vast and diverse as Texas, homes with tight insulation or poor ventilation can still trap radon at dangerous levels. The absence of historical data does not mean your home is safe – it means testing is even more critical to uncover any hidden hazards.

The Problem with EPA Radon Maps
EPA radon maps provide a broad look at regional radon trends, dividing areas into Zones 1 (high), 2 (moderate), and 3 (low). However, these maps rely on county-wide averages, which can mask significant local variations. A Zone 3 designation may suggest “low risk,” but a single home over uranium-rich soil could still exceed the EPA action level of 4.0 pCi/L, while a neighboring property tests far lower.
This broad approach creates a false sense of security, leading homeowners in lower-risk zones to skip testing entirely. Conversely, Zone 1 areas may prompt more awareness but still offer no guarantees. Variability between soil composition, construction styles, and air pressure ensures that no map can predict radon at the individual property level.
Radon Myth-Busting: The Truth You Need to Know
Many misconceptions about radon persist, leaving homeowners and businesses exposed to unnecessary risk. Here are the most common myths and the facts to set them straight:
Myth #1: “Newer homes don’t have radon problems.”
Truth: Modern, energy-efficient homes can trap radon gas more easily because of tighter seals and reduced natural airflow.
Myth #2: “Radon isn’t dangerous in low-risk areas.”
Truth: Radon hotspots can appear anywhere, even in counties labeled as “low potential.” Testing is always necessary.
Myth #3: “If my neighbor’s test was low, I’m fine.”
Truth: Radon levels can vary dramatically between homes – sometimes by hundreds of pCi/L – even if they’re side by side.
Your Radon Risk Checklist
Ready to take action? Here’s a quick checklist to assess your radon risk for your home or business:
Take Action This National Radon Action Month
Radon is invisible, odorless, and unpredictable – but testing is simple and effective. Your neighbor’s test results, EPA maps, or general assumptions cannot guarantee your home’s safety. Protect yourself and your loved ones by scheduling a radon test today with Southwest Radon Eliminators. A small step now can make a life-saving difference in the future.
Citations & Source(s):
Centers for Disease Control and Prevention. National Environmental Public Health Tracking Network. (n.d.) Web. Accessed: 01/02/2025. www.cdc.gov/ephtracking.
