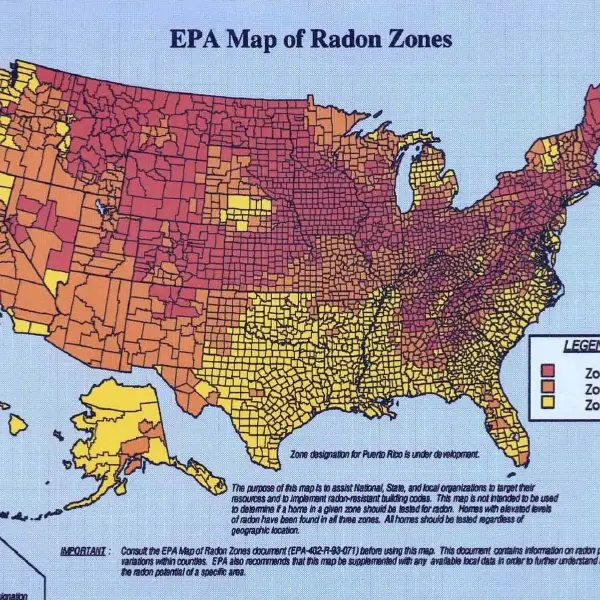
Many home and business owners have relied on the EPA’s radon maps to assess their risk level for indoor radon for over 30 years. These maps are even still referenced by many radon measurement professionals and organizations today. However, while these maps once served as useful tools to identify general trends, they are now outdated and do not reflect current radon levels and risks in many areas they represent.
The EPA’s Map of Radon Zones
Developed in 1993, the EPA’s Map of Radon Zones were created to identify areas in the US with the greatest potential for elevated indoor radon levels. These maps placed different counties into 3 different zone designations:
Why the EPA’s Radon Maps Are Misleading
While EPA’s radon maps broad classification provided some value at the time, it has significant limitations today. These maps do not provide any details, failing to account for localized variations in radon levels, updated geological studies, or the impact of new construction. As we have covered extensively in previous blogs, these factors can dramatically change radon exposure risks in specific areas.
Outdated Data
The primary issue with the EPA’s radon maps is that they have not been updated to reflect new data or research since their creation. Over the past three decades, radon levels have been measured in far more locations, yet the EPA’s county-level risk assessment has remained unchanged. This means that areas once considered low risk may now have significant radon problems, while high-risk areas may have seen reductions due to widespread mitigation efforts.
Modern Building Practices
Additionally, the maps fail to reflect how modern building practices have changed radon risks. A 2025 study in Proceedings of the National Academy of Sciences found that outdated, county-level radon maps have misrepresented exposure risks, leading to homes being built without radon-resistant features in areas mistakenly considered low-risk. As a result, many of these homes now test at unexpectedly high radon levels.
Radon is a Localized Problem
One of the most misleading aspects of the EPA’s radon maps is that they categorize entire counties based on limited data points. Radon levels can vary significantly from home to home, even within the same neighborhood. Geological differences, soil composition, and structural factors all contribute to radon infiltration, making county-wide assessments unreliable. A home sitting on a radon-producing granite deposit could have high levels, while a home just a few streets away may have little to no radon exposure.
How Modern Radon Data Provides Greater Precision
To illustrate the differences between the outdated EPA maps and modern radon data, we can compare their broad classifications with the detailed findings from the IEA Radon Report Cards, which have compiled data collected by the CDC’s National Environmental Public Health Network and other health organizations.
New Mexico
In New Mexico, the EPA categorized most of the state as Zone 2, with eight counties in Zone 1. Modern testing tells a different story: according to the IEA’s radon report card, over 3,700 radon tests show that 28% of buildings exceed the EPA’s action level of 4 pCi/L, with the mean pre-mitigation levels for 11 counties being above 4 pCi/L. However, there are several counties, such as Bernalillo and Santa Fe, that have shown reduced radon, with average levels below the EPA’s action level.
Texas
Texas is another example of how outdated maps can misrepresent risk. The EPA largely placed the state in Zone 3, with only some portions of the Panhandle in Zone 2. However, testing data shows that 10% of the 4,615 tested buildings in Texas exceed 4 pCi/L. According to the CDC, the Dallas area in particular has recorded mean pre-mitigation radon levels of 7.8 pCi/L, well above what the EPA’s map would suggest (Zone 3 – below 2 pCi/L).
Colorado
Colorado has long been classified as a high-risk state, with most of it falling under Zone 1 on the EPA’s map. While this designation holds some accuracy, modern testing reveals more details. Over 168,000 radon tests show that nearly half of buildings tested exceed 4 pCi/L, with CDC data showing some individual tests exceeding 900 pCi/L. However, new data also shows 34% of the buildings testing below 2 pCi/L, a considerable decrease compared to the EPA map.
Arizona
The EPA’s map designates the entire State of Arizona as Zone 2, indicating a moderate risk level. However, localized data shows significantly more variance. According to the IEA report card, we can see that 60% of the 3,589 structures tested showed radon levels below 2 pCi/L and 17% showing levels above 4 pCi/L. In fact, according to the AZ DHS’ Environmental Public Health Tracking database, 17.4% of pre-mitigation tests in Maricopa County alone have levels well above 4 pCi/L.
The Importance of Radon Testing
So, what does this all mean? Simply put, regardless of where you live or when your property was constructed, it is imperative you test your home or business for radon. While modern data provides a far more accurate and detailed representation of radon trends in your county than the woefully vague and dated EPA maps, it still has its limitations. The only way to truly know if your home or business has radon is to have it tested by a certified radon measurement professional.
If you need residential or commercial radon services, including testing and mitigation, contact Southwest Radon Eliminators today!
